
Infographic’s Relationship with Inbound Marketing
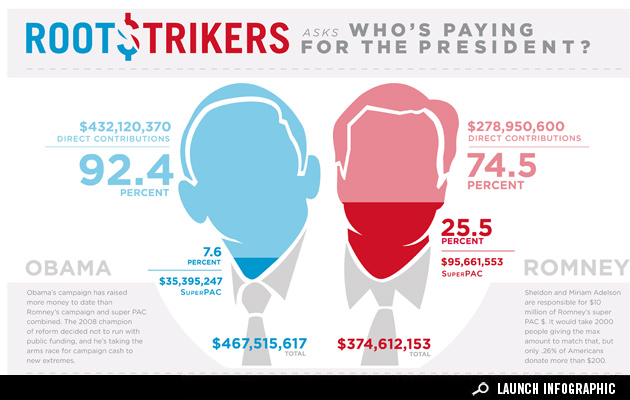
The usage of visualization for data is becoming more popular, and rightfully so because visual data can be used in so many interesting ways. Now, it’s possible you’re not familiar with visual data, which is also known as infographics, but it’s very likely you’ve seen one in the media. For example during the presidential campaign many news stations used visual data to showcase surveys and poll data.

With its bold and colorful text and images, visual data ultimately makes understanding stats much easier. It’s a quick synopsis of the most relevant information you want to convey and it covers the challenges and obstacle of your target market. Other brands like Google use them to graphically explain trends or introduce new tools and its supporters.
The 5 Benefits of Infographics
- Easy to Read
- Better Retention
- Simple to Share and Repost
- Visually more Appealing to Readers
- More Engaging than Text-Based Articles
If you’re in the processes of creating a new inbound marketing strategy, you might find visual data useful for developing your message and supporting your point of view.
So, where should you use visual data? Here are the most popular ways businesses use infographics for Inbound Marketing:
Increase website traffic from Social Media
Use infographics to draw in new users and bring them back to your website. A great place to upload an infographic is on your Facebook fan page. Fans can share the infographic, leave comments, and this will increase impressions and clicks to your website. Twitter is another avenue. Start a conversation using the infographic. Try rolling out a series of tweets instead of just one. Pinterest and Tumblr are other platforms infographics translate well in. Start a board in Pinterest for infographics and pin others to create exposure and re-post on Tumblr so your customers can read and pass it on.
Lead Generation: White Papers & eBooks
Extract the most compelling data from a white paper on a new product or service and put into an infographic. Send the infographic in an email to trigger a lead nurturing campaign. Recipients will be more enticed by the visuals and can quickly understand your message at a glance – which is all the time you have.
Now that you have some ideas, what’s next? Here are a few visualization software websites you can use to create an infographic:
Just, for fun we created an example of a simple infographic supporting visual data and how effective the tool can be to convey a message.
